Hours
Minutes
Seconds
ENDING SOON: SAVE 20% ON YOUR FIRST VPS INVOICE

Performance Built On Discipline

Forex Royal AI measures performance through disciplined execution, transparent reporting, and continuous analysis. Every metric should be evaluated within the context of market conditions, risk management, and long-term consistency—not short-term results.

Our Trading Philosophy

Successful automated trading is built on disciplined execution, controlled risk, and continuous evaluation rather than prediction or emotional decision-making.

Data First
Every trading decision begins with measurable market information.
Risk Control
Managing downside remains as important as seeking opportunities.
Market Adaptation
Strategies evolve as market behavior continues to change.
Long-Term View
Consistency matters more than isolated trading outcomes.

Analysis Before Execution

Forex Royal AI evaluates predefined market conditions before initiating any trade. Every execution follows structured logic designed to reduce emotional influence while maintaining consistency across changing market environments.

Learn More
Data First

Protecting Capital First

Risk management is integrated into every trading framework. Position sizing, predefined exit conditions, and disciplined execution help create a structured approach designed for long-term sustainability rather than aggressive speculation.

View Methodology
Risk Control

Designed For Dynamic Markets

Financial markets constantly evolve. Forex Royal AI is continuously refined through research, testing, and performance evaluation to improve its ability to operate under different market conditions while maintaining consistent trading principles.

See Improvements
Market Adaptation

Built For Sustainable Performance

Rather than focusing on individual winning trades, Forex Royal AI evaluates performance across longer time horizons. This perspective helps measure stability, execution quality, and disciplined decision-making more effectively.
View Results
Long-Term View

Live Performance

Transparent performance reporting helps traders evaluate consistency, execution quality, and overall trading behavior over meaningful periods.

Equity and balance curves provide a visual representation of account development over time. Reviewing both curves together offers valuable insight into trade execution, floating positions, realized results, and the overall consistency of the trading strategy.

Drawdown is one of the most important measures of trading risk. Understanding how temporary declines occur—and how the strategy manages them—provides a more complete picture than profitability alone when evaluating long-term trading performance.

Comprehensive Statistics

Key algorithmic health and risk-adjusted return ratios.

Profit Factor
0
Max Drawdown
0 %
Win Rate
0 %
Sharpe Ratio

Monthly & Annual Returns

Built around speed, stability, automation, and professional trading standards

Year Jan Feb Mar Apr May Jun Jul YTD
2026 +5.4%+4.1%+6.8%+3.2%+5.9%+4.7%+6.1%+41.8%
2025 +4.8%+3.5%+5.2%+4.9%+6.0%+3.8%+5.1%+58.3%

Backtest Overview
& Methodology

Combining artificial intelligence, automation, and disciplined strategies for modern forex traders.

Backtest Results
Historical simulations using predefined market data.
Testing Method
Transparent methodology behind every reported performance metric.

Understanding Historical Performance

Backtesting evaluates how a strategy would have performed using historical market data under defined assumptions. While useful for validating trading logic, historical simulations cannot predict future market behavior and should always be interpreted alongside live performance and risk metrics.

Backtest Results

How We Evaluate Strategies

Our testing process emphasizes consistency, execution quality, and risk-adjusted performance rather than maximizing isolated returns. Multiple market environments, trading conditions, and optimization procedures help evaluate strategy robustness before deployment.

Click Here
Testing Method

Recent Trade History
& Setup Visuals

Detailed breakdown of recent trade execution logs.

Year Jan Feb Mar Apr May Jun Jul YTD
2026 +5.4%+4.1%+6.8%+3.2%+5.9%+4.7%+6.1%+41.8%
2025 +4.8%+3.5%+5.2%+4.9%+6.0%+3.8%+5.1%+58.3%

Performance
Questions Answered

Understand how we measure, evaluate, and present trading performance with complete transparency.

Why do you publish performance data?

Performance reports allow traders to evaluate our technology using measurable information rather than marketing claims.

We believe transparency helps traders make informed decisions. Performance should always be considered together with risk management, methodology, and market conditions—not as a promise of future results.

No. Historical or live performance cannot guarantee future outcomes.

Financial markets constantly change, and every trading strategy experiences different conditions over time. Past results should be viewed as evidence of previous behavior rather than predictions of future performance.

Profitability tells only part of the story. Drawdown measures temporary declines experienced while trading.

Understanding drawdown helps traders evaluate the level of risk associated with a strategy and whether it aligns with their personal risk tolerance and investment objectives.

Balance reflects closed trading results, while equity includes both closed and open positions.

Reviewing both metrics together provides a more complete understanding of account behavior throughout different market conditions.

Performance information is updated whenever new verified trading data becomes available.

Regular updates provide a more accurate picture of ongoing strategy behavior while maintaining transparency regarding recent trading activity.

Our objective is to build long-term trust rather than attract attention through unrealistic claims.

Professional traders evaluate consistency, risk management, execution quality, and transparency—not only headline returns.

No. Backtests are valuable research tools but should never be the only evaluation method.

Live performance, execution quality, risk metrics, and market adaptability all contribute to understanding a trading system’s effectiveness.

Yes. Every trading strategy is influenced by changing market conditions.

Volatility, liquidity, spreads, and macroeconomic events can all impact trading behavior and performance over time.

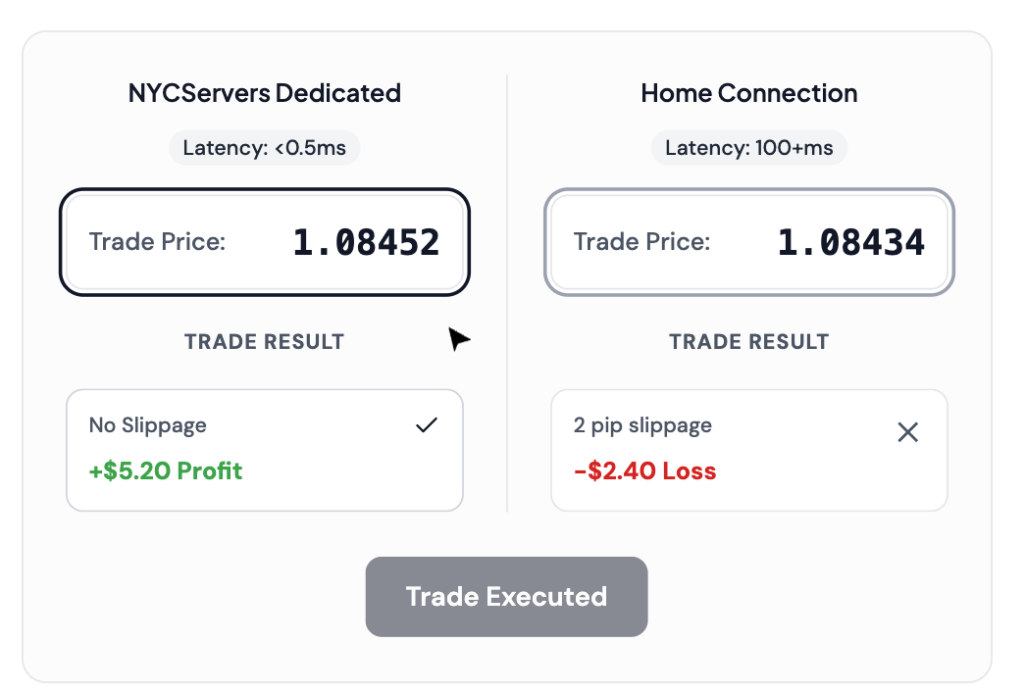
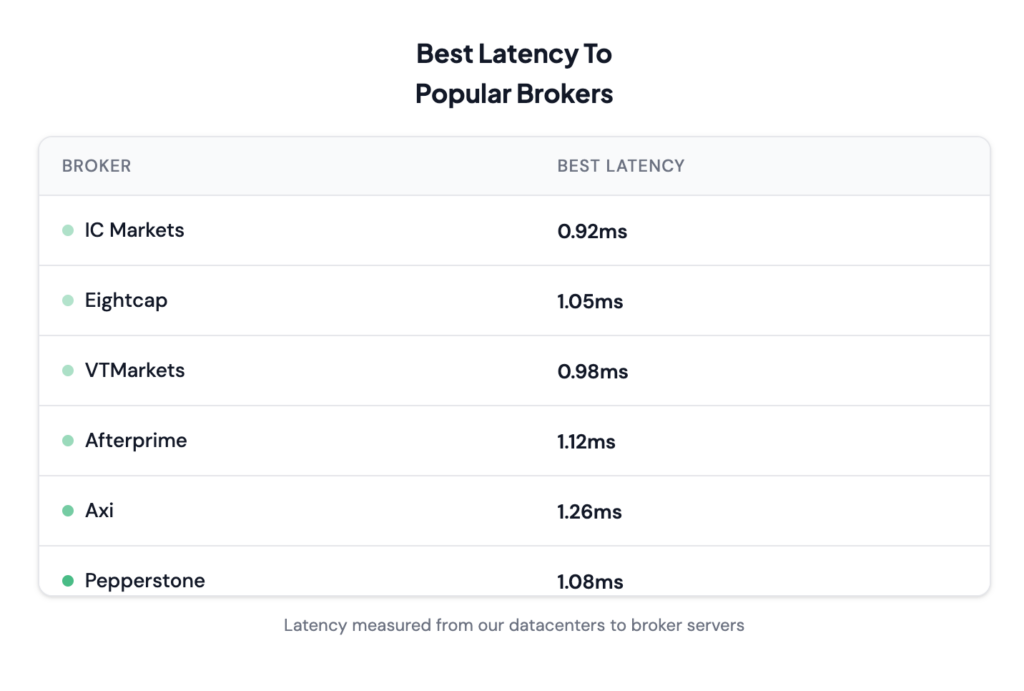
Different brokers, account types, spreads, latency, VPS quality, and trading settings may influence execution.

Even when using identical software, small differences in trading environments can produce different outcomes.

Consider the complete picture rather than a single performance metric.

Review methodology, risk management, drawdown, consistency, transparency, and long-term execution before making any purchasing decision.

Still Have Questions?

Visit our knowledgebase or reach out to our 24/7 support team

Trusted by Traders

Real experiences from traders using automated technology worldwide

5
“NYC servers have the best VPS its very fast and reliable and able to deliver the professional standard required when my money is on the line. I’ve tried some others and I don’t trust them to be reliable and fast enough to do the job required…”
Thomas L.

Professional Forex Trader

5
“NYCServers is the only forex VPS provider I can test to run my trading algorithms without fail.”
Mike P.

EA / Algo Retail Trader

5
“”We manage multiple accounts and the reliability is crucial. NYC Servers has delivered 100% uptime as promised. Their infrastructure is rock solid and the customer service is exceptional.” “
Thomas L.

Retail Forex Trader

4.5
“Running my EAs 24/7 without any downtime has been a game-changer. The support team helped me optimize my setup, and now my strategies ru…”
Harrison R.

Retail Forex Trader

5
“There is no better VPS service anywhere. Customer support is excellent. You pay a little bit more, but the level of service is worth it.”
J. Woodward

Professional Forex Trader

5
“I had problems installing my Telegram copier program on the VPS but the support team resolved the issue within 20 minutes and now everything is working perfect”
Igor S.

Retail Forex Trader

5
“Ordered a VPS and received my login details instantly. Setup my trading software and was live within 20 minutes after order. Simple and easy”
Thandi M.

EA / Algo Retail Trader

5
“Recommend newyorkcityservers to any robot traders. Their service is fast and support is actually helpful”
Maximilian W.

Professional Forex Trader

Understanding Performance
Beyond Returns

Professional traders evaluate consistency, methodology, risk exposure, and execution quality before focusing on profitability alone.

Performance Metrics
What Performance Numbers Really Mean

Trading statistics only become meaningful when interpreted within the proper context. Metrics such as profit factor, win rate, expectancy, drawdown, and recovery factor should be evaluated together rather than individually. A high return with excessive drawdown may represent a very different level of risk than a strategy producing steadier, more consistent growth. Understanding these relationships helps traders make informed decisions based on evidence instead of isolated numbers.

Risk Analysis
Consistency Matters More Than Peaks

Short periods of exceptional performance rarely define a successful trading system. Sustainable trading is built on disciplined execution across different market environments. Evaluating long-term stability, controlled drawdowns, and consistent strategy behavior provides a more reliable assessment than focusing only on the highest returns achieved during favorable market conditions. Professional evaluation always balances opportunity with responsible risk management.

Get In Touch

Have questions about our services? Want to learn more about how we can help your trading? Our team is here to help you succeed.

Send us a Message

Fill out the form below and we’ll get back to you as soon as possible.